HealthCheck Assistance

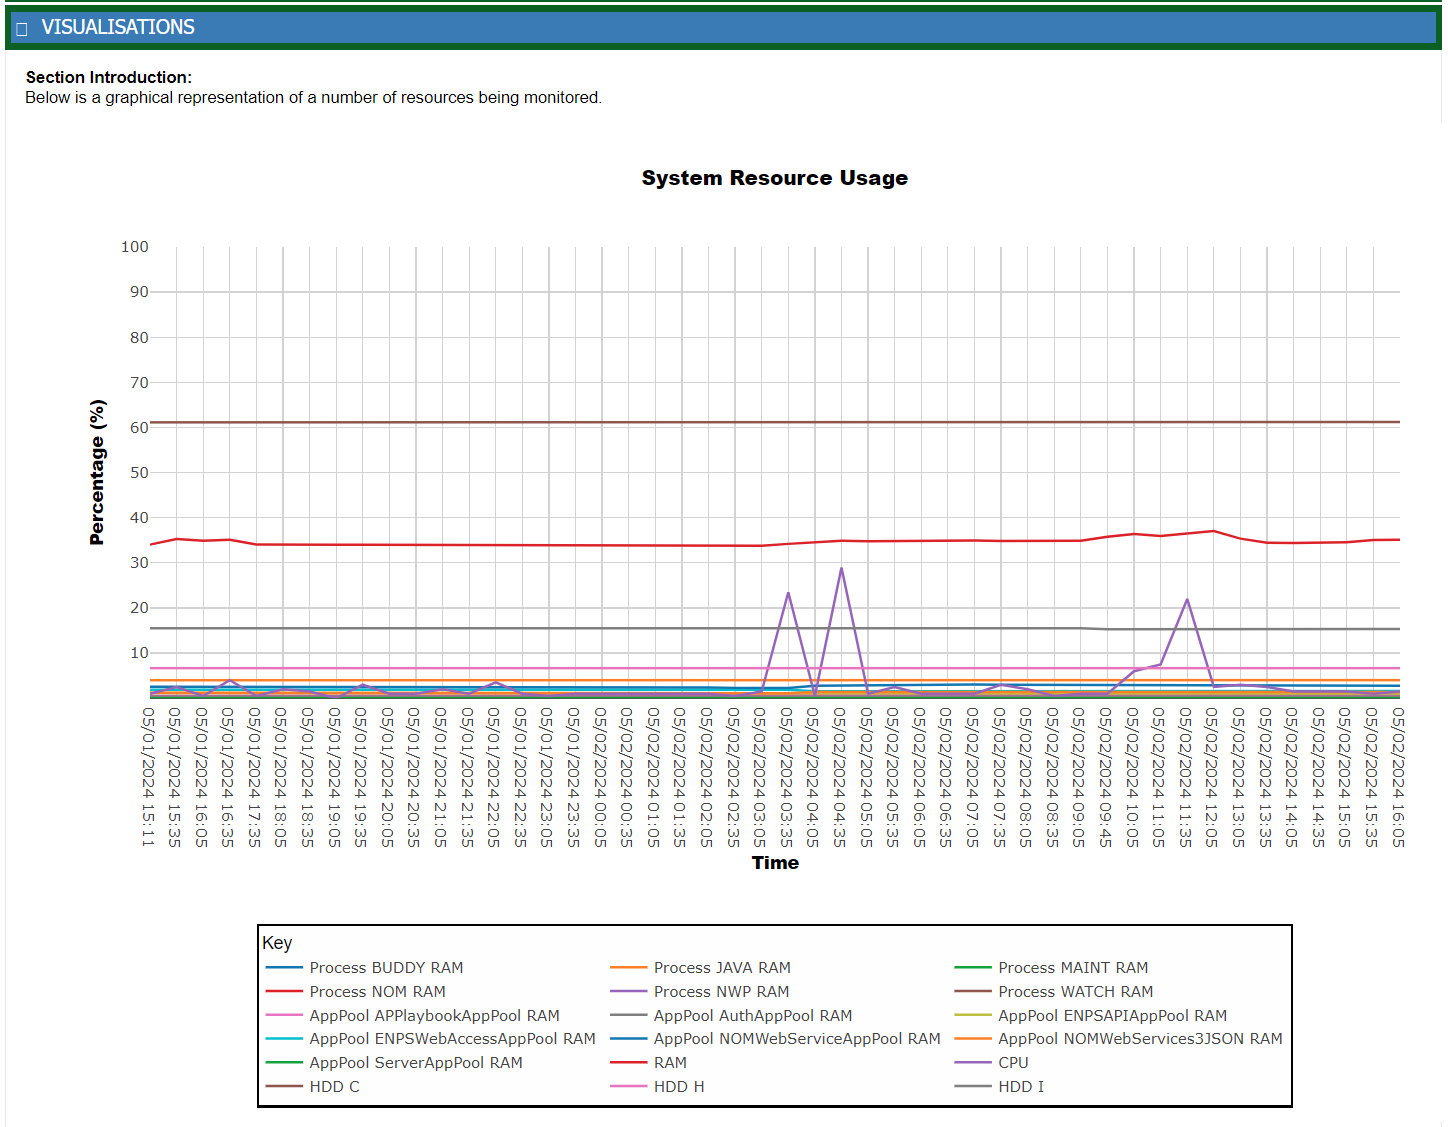
There is an option to enable a rolling 24 hours of system resources to be viewed as a graph. For example, memory (RAM) and CPU utilization, along with storage details and Java memory usage.
Please note that the mechanism to calculate utilization across a multiple processor and core system is difficult and hence this uses a basic sampling approach as an indicator only.
Once the above is enabled, a new sectional header will appear on the
Heart Beat Detailed mail, titled "VISUALIZATIONS". When
expanded, a graph will be displayed. It will take 24 hours to be fully populated as the history grows.
For systems with no internet a slightly more resource intensive process allows for the creation of an encrypted, embedded JPG image, for systems with internet access, a JavaScript graphing script is used which is the default.
NOTE: If you have any questions, please contact AP ENPS Support before making changes to the HealthCheck configurations.
To enable this it is set within \hc\hc-static_config.ps1. With the default being:
$global:HC_AP_Mail_Heartbeat_Visualisation = $false # Enable Visualisations to e added to HeartBeat Mail messages
$global:HC_Mail_Heartbeat_Visualisation_JPG
= $false # Use stand alone JPG for visualisation. Select if no internet access.
(Default: $false)
$global:HC_Mail_Heartbeat_Visualisation_JavaScript
= $true # Use Javascript for visualisation. (Default: $true)